

FIRST FREE LIVE SESSION Gold · Sunday, October 11 · 7 PM CentralView event
← All demosSUMMIT / GUIDED SCREENSHOT TOUR

A bullish view.
A separate readiness check.

Explore a real Summit dashboard: separate bullish and bearish evidence, developing Trade Readiness, key levels and the six-pillar explanation.

SUMMIT INTERACTIVE TOUR
Price in context01 / 04
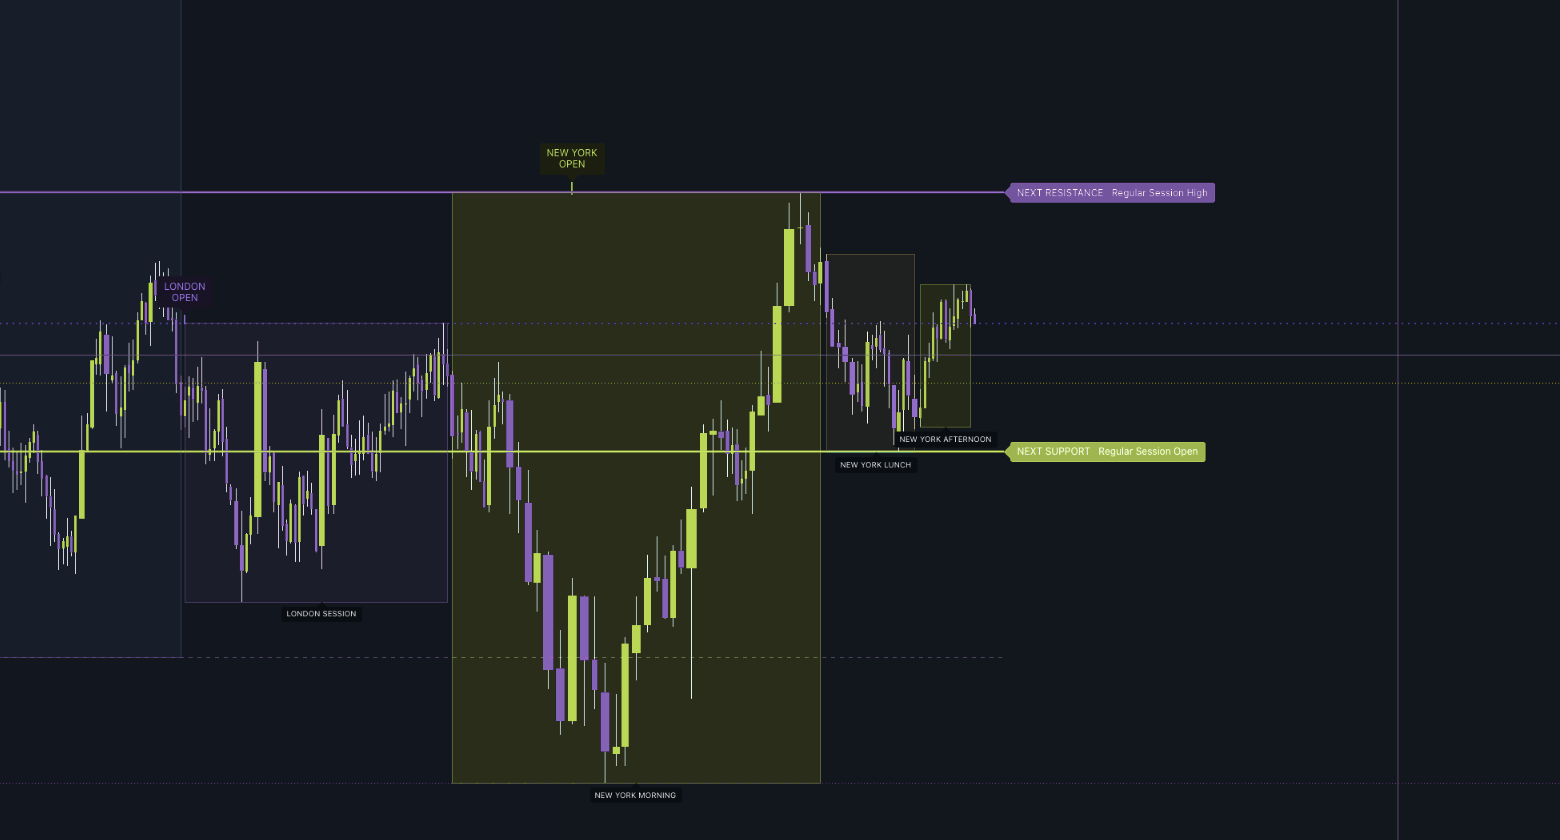
Actual Summit MGC chart crop with session ranges and next support and resistance labels.Inspect detail ↗
Levels to inspect, not orders to follow.

Bring price and context into one view.

Session ranges and mapped support and resistance frame the price action. Explore the next chapters to see how evidence and readiness differ.

Earlier Summit v2.0.3 interface capture. The current update is v2.1; presentation may differ. Montinac colors applied. Guided stills, not a live chart, video or performance record.

Read all four chapter explanations
  1. Bring price and context into one view.Session ranges and mapped support and resistance frame the price action. Explore the next chapters to see how evidence and readiness differ.
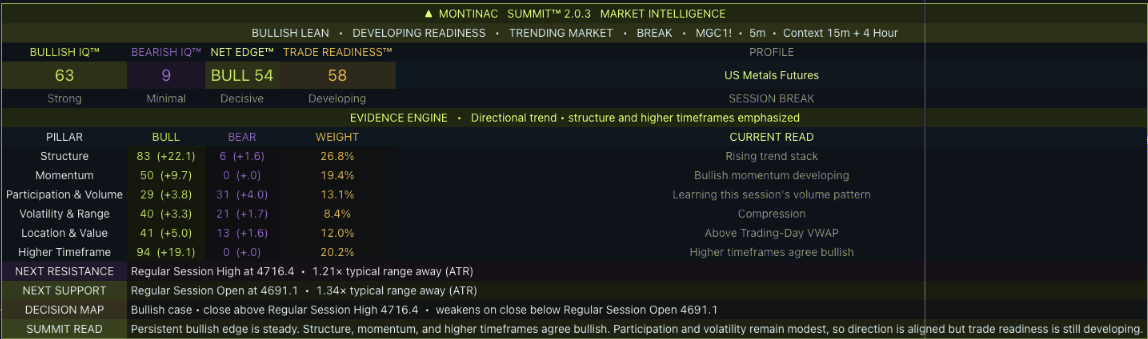
  2. Read both sides of the market.In this saved view, Bullish IQ is 63 and Bearish IQ is 9. They are independent evidence scores, not percentages that must add up to 100.
  3. Direction is not the same as readiness.The same snapshot has a bullish edge, but Readiness is only 58: Developing. The environment and nearby levels matter alongside direction.
  4. See what supports the conclusion.Detailed mode exposes Structure, Momentum, Participation, Volatility, Location and Higher Timeframe. Each pillar contributes to the evidence scores.

Earlier Summit v2.0.3 interface capture. The current update is v2.1; presentation may differ. This tour changes the feature in focus, not the market time. It is not a backtest.

What the scores mean

Bullish IQ and Bearish IQ are independent 0–100 evidence scores. Net Edge is their difference. Trade Readiness is a separate environmental assessment. None is a calibrated probability of profit.

How confirmation works

Summit evaluates the previous completed chart bar and confirmed higher-timeframe inputs. That deliberate delay is part of the design. Current terrain, settings, history and corrected data can still change a saved view.

CURRENT BUILD / RELEASE NOTES

Summit v2.1.0

Session integrity and clearer presentation.

The update retains six analysis pillars, independent bullish/bearish evidence and separate Readiness. Session resets use dated anchors, session-relative volume compares clock positions, and VWAP provenance is made explicit.

Larger type, optional neutral surfaces and hover explanations improve the display. Detailed alerts can include the source timestamp and mapped levels; they do not execute trades.

The screenshot tour uses the earlier v2.0.3 interface; it is not a native recording of v2.1.0. Always evaluate the current publication and your settings on paper before relying on the readings.

Understand developing and confirmed readings →
SUMMIT / THE COMPLETE WORKSPACE

See the scope.
Choose your access.

From $39/month. Monthly, annual and lifetime options.

View Summit plans
ACTUAL INTERFACE

Chart detail

Historical interface screenshot with Montinac colors applied, not live data or a performance report. Other indicators may be visible.