

Which side leads?
Independent Bullish IQ and Bearish IQ scores organize six analysis pillars. Net Edge summarizes their separation without disguising conflicting evidence.

Separate bullish and bearish evidence from Trade Readiness. See mapped decision levels and the reasoning behind the read.
The film could not start. Try Play again or use Open video.
Go deeper into the workspace after the film.
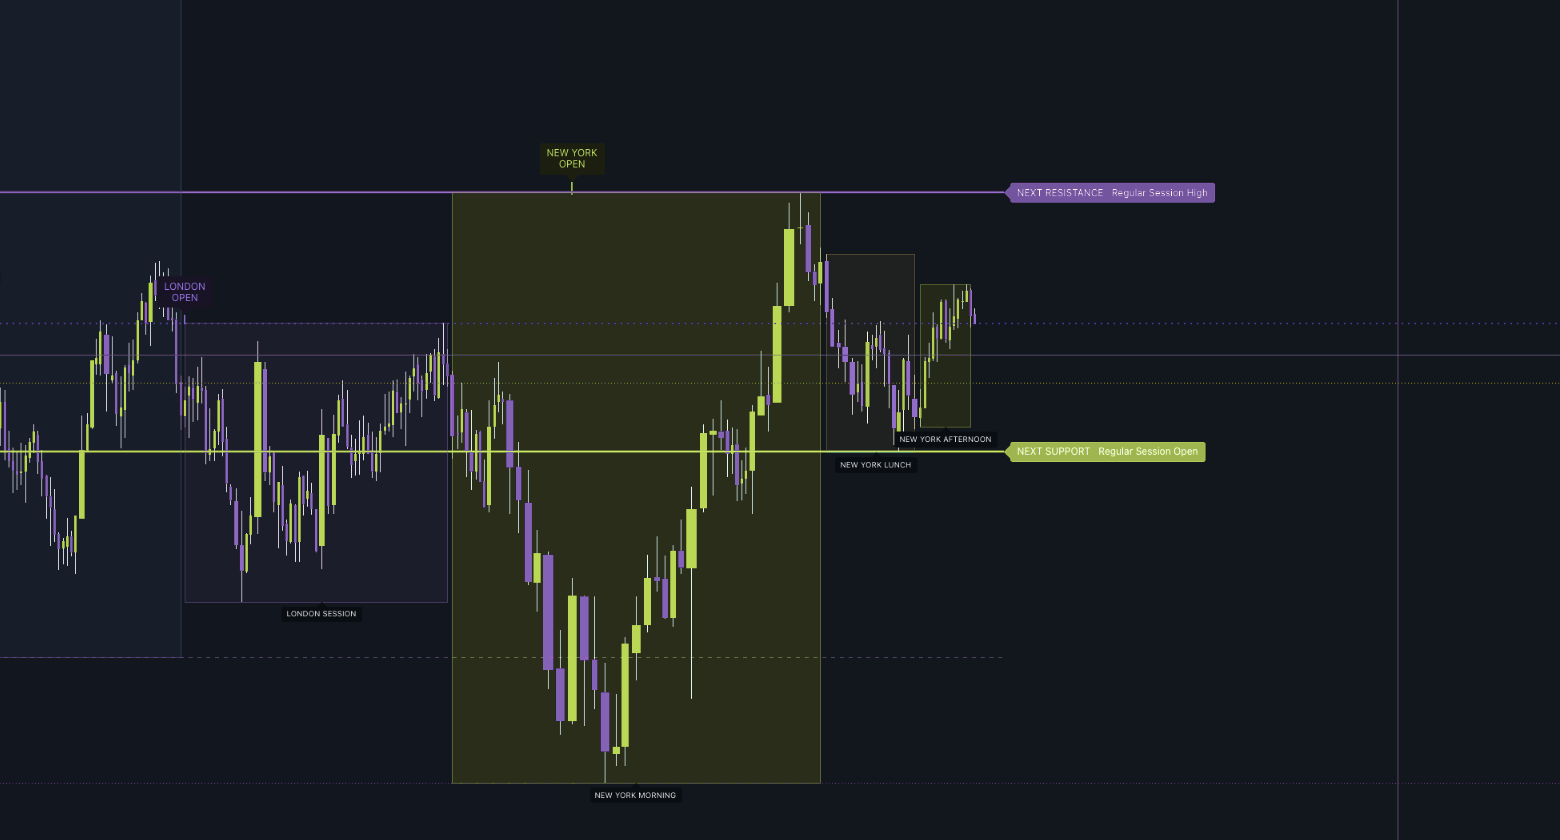
Session ranges and mapped support and resistance frame the price action. Explore the next chapters to see how evidence and readiness differ.
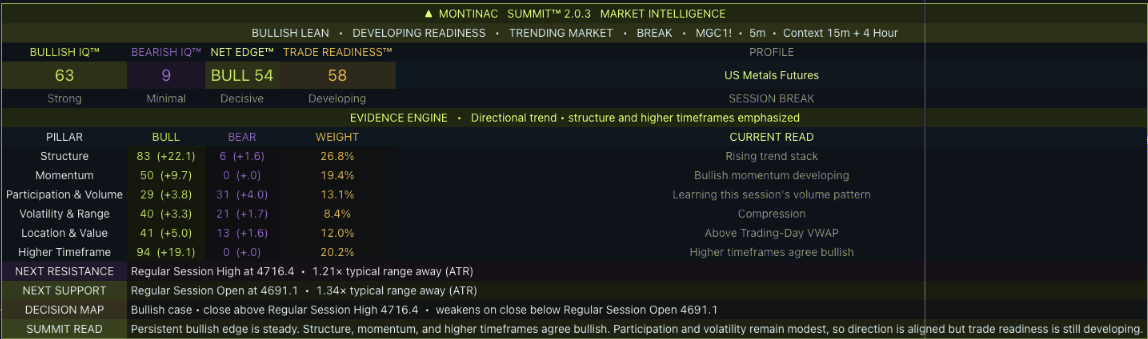
In this saved view, Bullish IQ is 63 and Bearish IQ is 9. They are independent evidence scores, not percentages that must add up to 100.
The same snapshot has a bullish edge, but Readiness is only 58: Developing. The environment and nearby levels matter alongside direction.
Detailed mode exposes Structure, Momentum, Participation, Volatility, Location and Higher Timeframe. Each pillar contributes to the evidence scores.
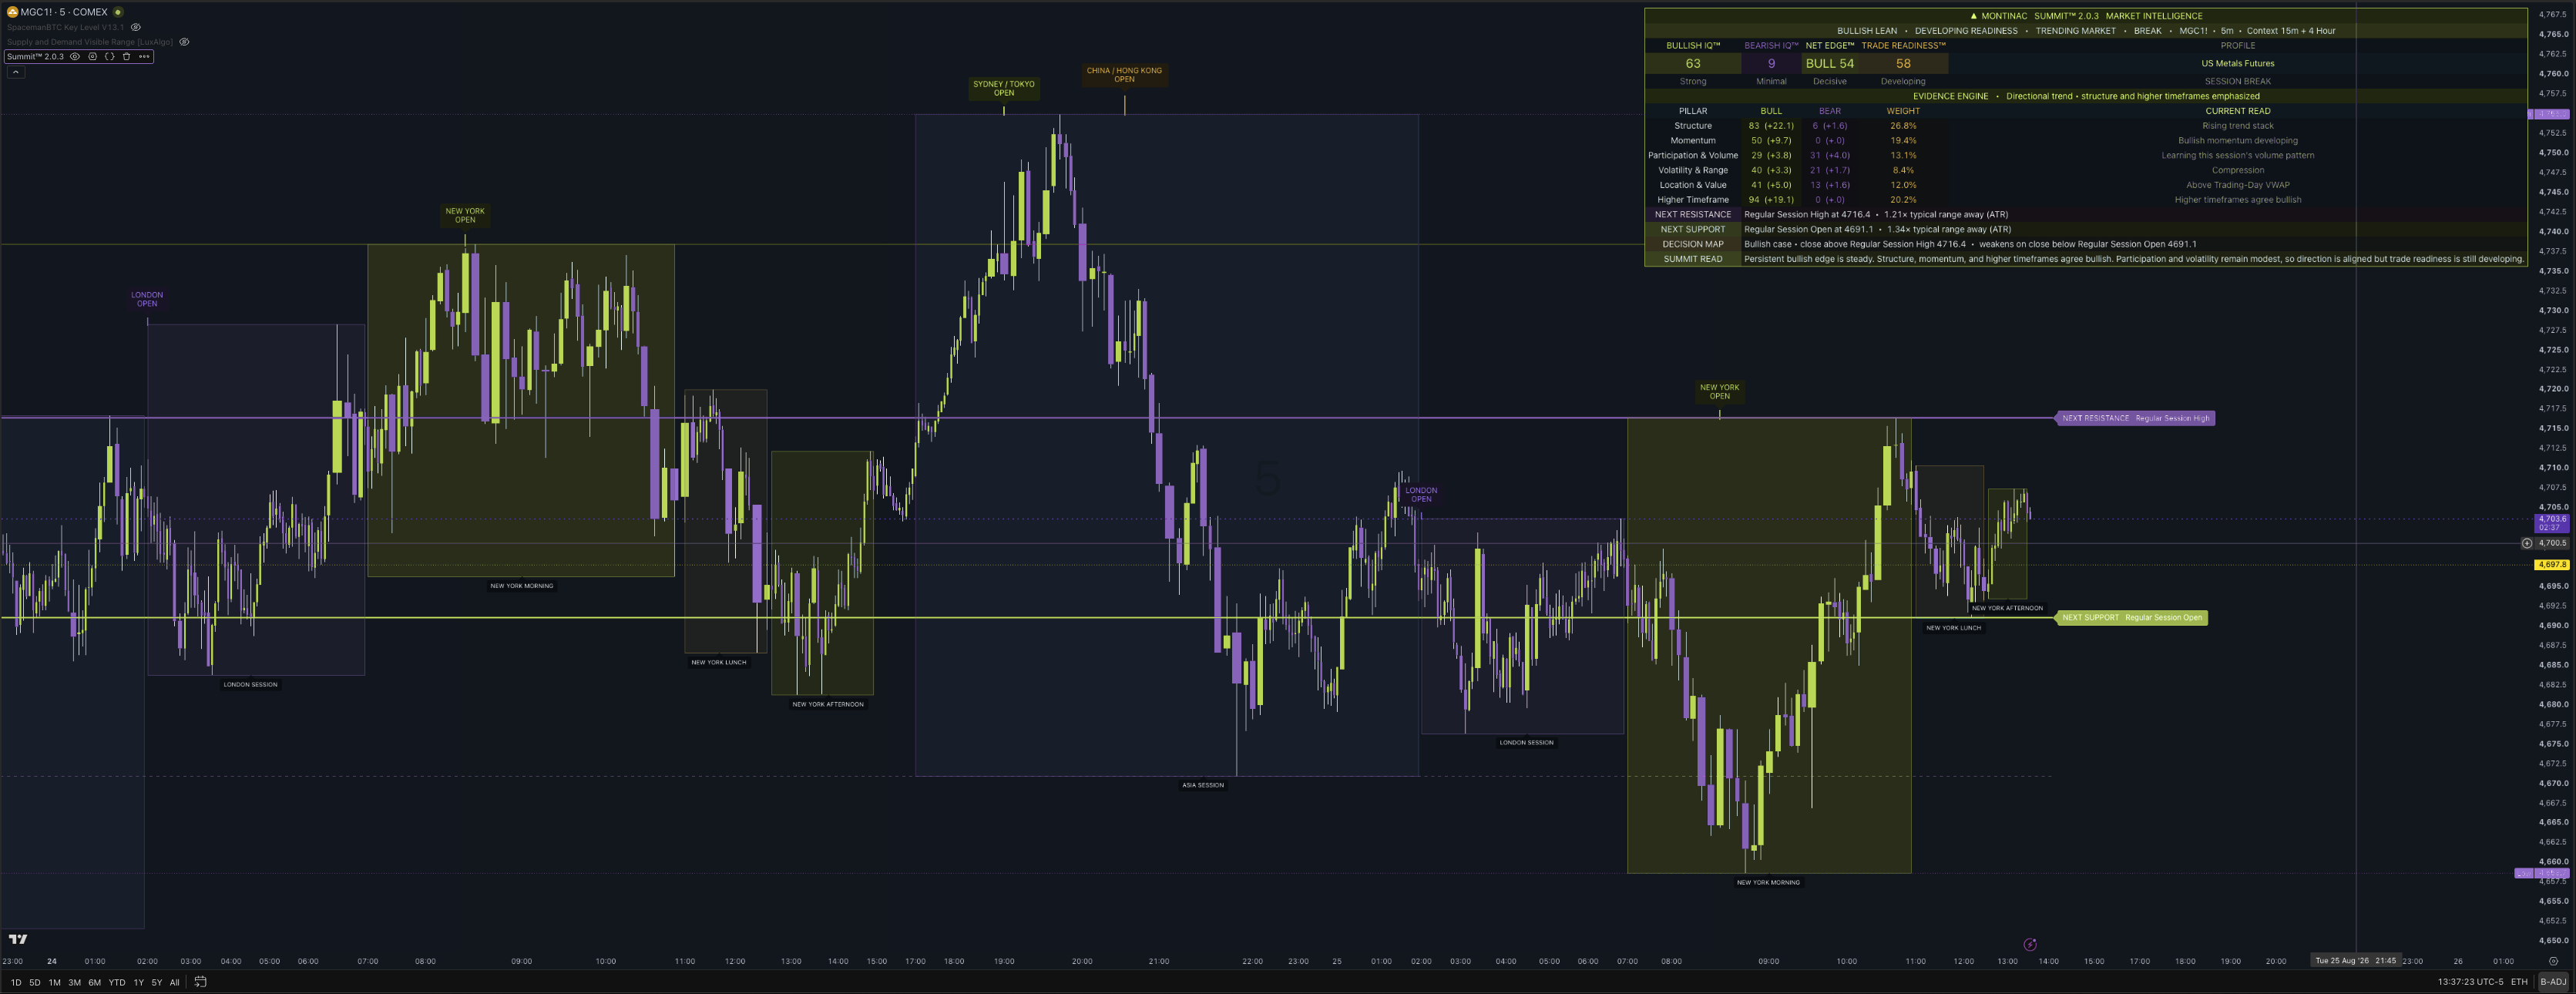
Earlier Summit v2.0.3 interface capture. The current update is v2.1; presentation may differ. Montinac colors applied. Guided stills, not a live chart, video or performance record.
Want the full explanation? Open the Summit walkthrough and release notes ↗
Independent Bullish IQ and Bearish IQ scores organize six analysis pillars. Net Edge summarizes their separation without disguising conflicting evidence.
A separate Readiness reading considers the environment and room to a mapped obstacle. Direction can lead while Readiness remains low or developing.
The Terrain Map brings support, resistance, session references and value into the same chart. The Decision Map gives two-sided conditions to inspect.
Compact keeps the decision hierarchy close. Detailed exposes the six pillars. Mobile reduces the footprint for smaller charts. All modes use the same evidence framework.
Chart readings evaluate the previous completed chart bar, with confirmed higher-timeframe context. This introduces a deliberate delay. Active mapped drawings and revised data can still change the visible map.
Designed for liquid futures, US cash indexes and index options, equities, spot forex, and 24/7 crypto markets. Auto profiles recognize major futures families and supported option workflows; Custom controls remain available for unusual symbols. Instrument behavior and data quality vary.
Profiles are analysis settings, not a universal exchange-calendar feed or proof of performance. Verify your market profile, history and data. Scores are heuristic evidence, not calibrated win probabilities. Summit does not place trades.
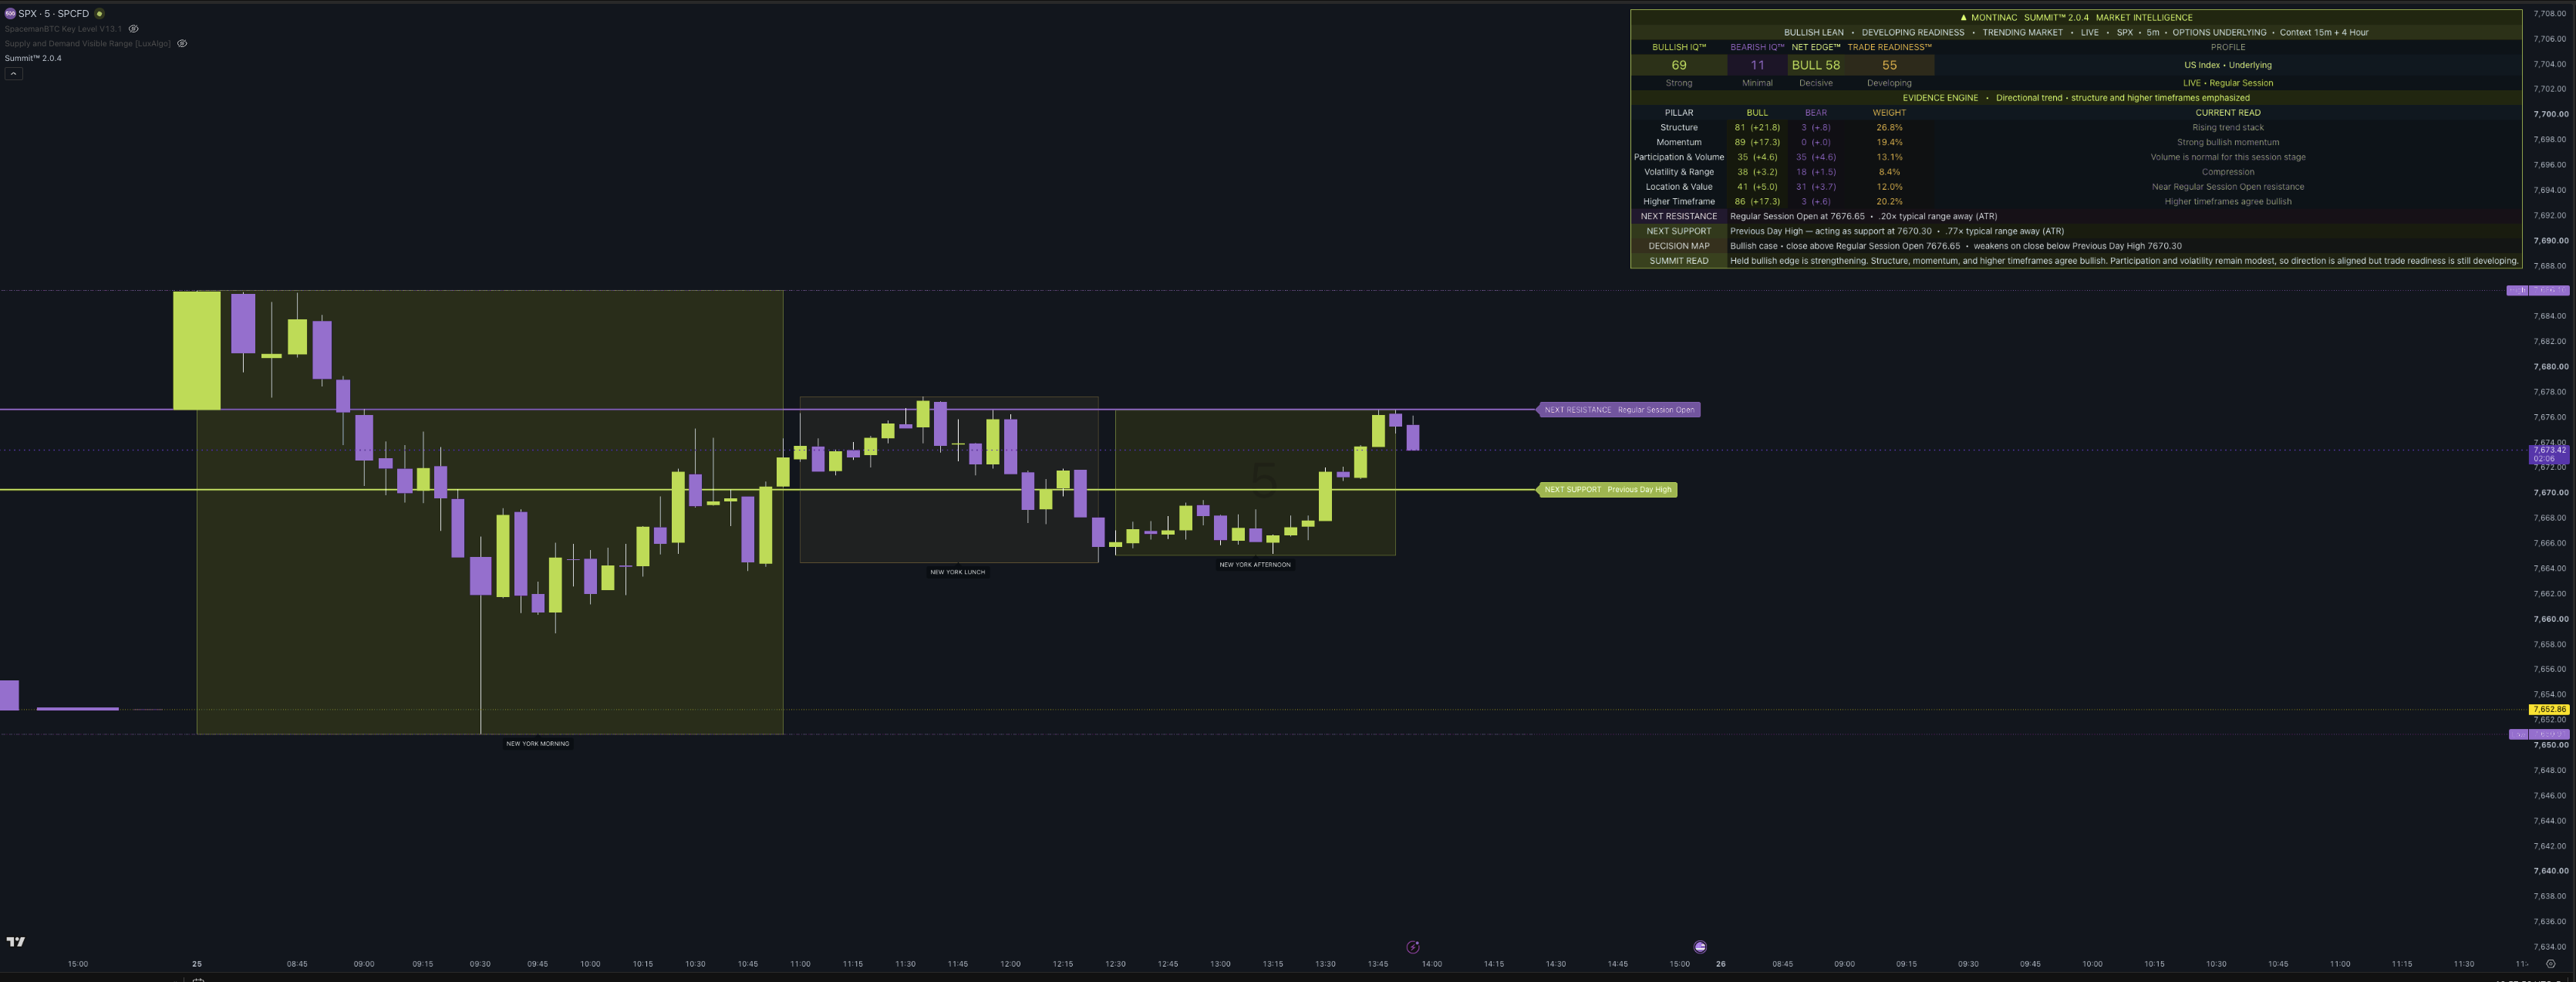
Historical captures from earlier Summit versions. Use 100% view to inspect the original pixels.
Summit only, for one TradingView account.
Manual authorization after payment verification.
Flexible access. Cancel anytime.
Save $169 versus twelve monthly payments.
Ongoing Summit access without a subscription.
USD before applicable tax. Annual access is charged $299 each year. Lifetime is one $749 payment for Summit under the service terms. Obsidian and future products are not included. View the TradingView publication ↗
No. Summit and Obsidian are separate products with different jobs. Choose Summit for market context and readiness, or Obsidian for structure-based futures pullbacks. Each plan covers the named indicator only.
We verify your paid order and the TradingView username you provide, then manually authorize that account. Payment does not instantly install the indicator. Keep your receipt and use My access or contact support for access questions.
No. A TradingView account is required. Any applicable TradingView subscription, real-time data, broker service or exchange fee is separate. Check the chart and alert capacity of your own plan before purchase.
No. Monthly, annual and lifetime options include the complete selected indicator while access is active. Monthly and annual plans renew until canceled. Lifetime is one payment for ongoing access to that indicator and eligible updates under the service terms; it does not include other or future products.
No. These are analysis tools. You control entries, exits and protective orders. Scores are not winning probabilities; Obsidian’s plans are model references, not broker fills or protected positions. Review the risk disclosure.
Monthly and annual subscriptions can be canceled before renewal, with access through the paid period. Review the current refund policy before purchasing. Contact support for account assistance.